Field Monitoring
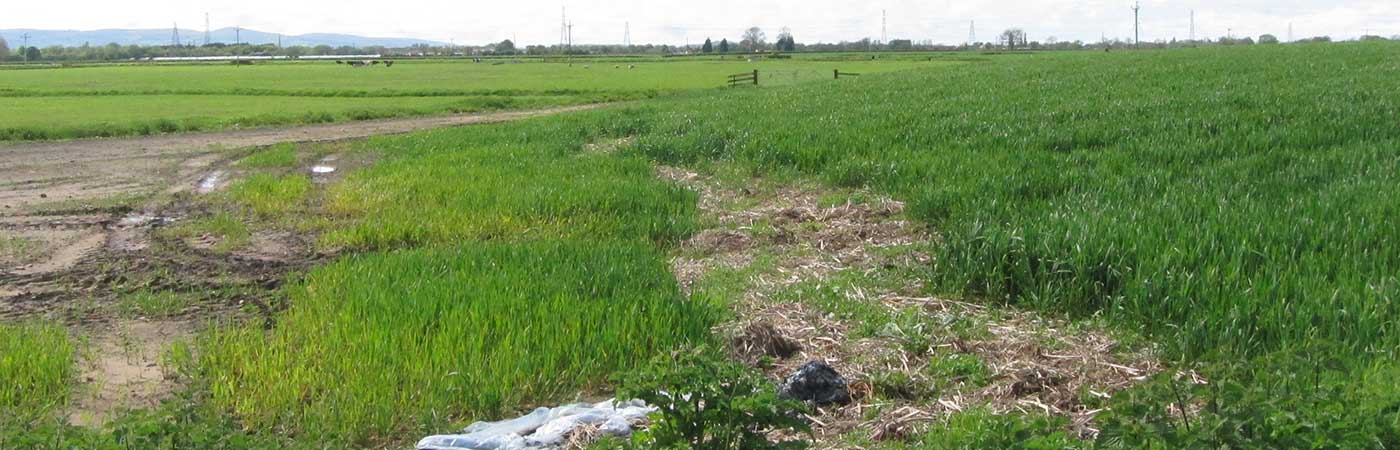
Immediately after the last of the flood water had receded in April 2014, we located a total of 15 study sites that had been severely affected by the winter floods. These sites were spread across Somerset, Worcestershire, Herefordshire, and North Wales. After an initial survey, we selected five of these sites to study in more detail every month; these sites were selected for having a clear definition between ‘Flooded’ and ‘Control’ (not flooded) areas. Soil density, above ground biomass, soil pH, soil salinity, and soil nutrients (phosphorous, ammonium, nitrates) were measured monthly at each site.
Preliminary results
Plant yields
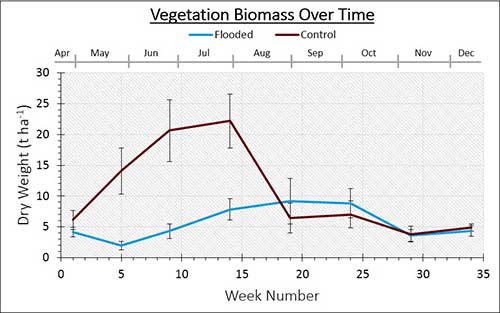 Plant yields were significantly lower in flooded areas during May, June and July, but this may have been due to the difficulty of sewing crops in the muddy flooded areas. The two grasslands we sampled showed similar yields in both flooded and control areas during this period. Once crops were harvested in August and the fields were re-seeded, the yield of flooded and control areas were similar.
Worm numbers
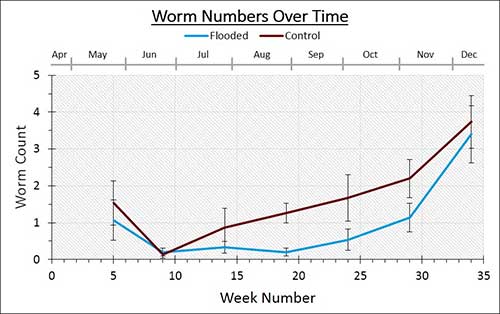 Worm numbers have steadily been increasing since the flooding, although there was a dip in worm numbers in June. This dip was likely due to the warm, dry weather – we sampled to a depth of only 25 centimetres, and the worms were likely deeper than this in the wetter soil underneath. Throughout the sampling period, there were generally fewer worms in the flooded areas than in the control areas, although this difference has been decreasing.
Soil
Soil bulk density and water infiltration rates did not differ between flooded and control areas. This was perhaps due to the fact the control areas were subject to soil compaction by heavy machinery. As such, any soil compaction caused by the flooding in the flooded areas would be hard to differentiate from soil compaction by machinery in the control areas. There was a downward trend in water infiltration rate towards the end of the sampling period (October – December), which is likely due to the weather conditions – the wetter the soil, the lower the infiltration rate.
 Soil salinity was lower in the control areas than in the flooded areas, although this difference lessened in September when many of the fields were re-seeded. The higher salinity in the flooded areas was most likely due to salt deposits left by the flood water.
Soil pH didn’t differ greatly between flooded and control areas, but it was slightly lower in the flooded areas. There were fluctuations in soil pH in April to June, which were likely due to the soil drying out, the addition of several fertilisers, and the sewing of crops after the flood water receded.
Soil respiration peaked in June and August, but there was a dip in July. Generally, soil respiration in flooded and control areas were similar, except in May and June where microbial communities may still have been recovering from the flooding. Soil respiration is measured by quantifying the amount of carbon dioxide (CO2) released from the soil. This carbon dioxide is given off both by the microbial community and by the plants themselves, so it is merely an indication of microbial activity rather than a direct measurement. The microbial activity in the soil is impacted by both moisture and temperature. Generally, the higher the soil moisture and soil temperature, the more microbial activity there is, and more CO2 is released. Microbial activity tends to decrease later in the year due to the lower temperatures – this was also evident in the results. The peaks in soil respiration in June and August were likely due to high temperature and high soil moisture. The dip in soil respiration in July was likely to have been due to very low soil moisture levels.
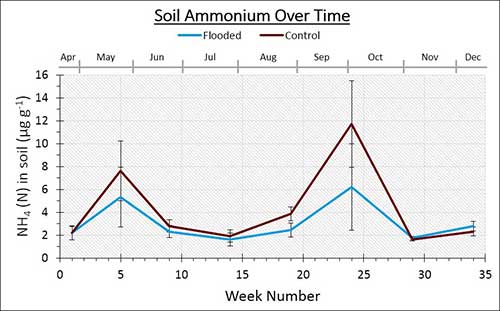 Soil nutrient levels didn’t tend to differ between flooded and control areas, but they did change over time. Large spikes in ammonium, nitrates and phosphates are evident around the time the fields were fertilised and re-seeded (in May and September).